
Using Graphics in Online Courses

When used appropriately, graphics can be a powerful tool in your online course. In addition to providing aesthetic appeal, graphics provide a visual component to your instructional materials that can complement or even enhance your written content. What’s critical, however, is that graphics are used in a way that supports, rather than distracts from, written course content. By remaining cognizant of the types of graphics and how they can be used within fair use guidelines, you can maximize the use of these visual elements to enhance the instructional materials in your online course.
Types of Graphics
Graphics refer to visual images that convey crucial information or provide aesthetic appeal to the information presented. A few common examples of graphics are icons, illustrations, photographs, graphs, diagrams, maps, art, and animations.
Educators agree that well-designed courses should accommodate different learning styles. In particular, in order to reduce cognitive load and meet the needs of diverse learners, students learn better from words and pictures together than from words alone (Clark & Mayer, 2016). With this in mind, graphics are much more than just visual images; they serve an important role in the learning process. By carefully selecting graphics, you can communicate this information in a clearer and more engaging manner.
Here are four main types of graphics that can help you enrich your students’ learning experiences:
Representational

Representational images are graphics that describe or portray content that focus on the components that students should learn. When selecting a representational graphic, the purpose is to depict the physical appearance of an object. Think of illustrations and diagrams that provide a realistic outline to accompany the text. The science, health, and engineering fields frequently use these types of graphics to explain or clarify a complex topic. Moreover, they add instructional value to the course, especially for visual learners. For instance, a biology class might consider a representational graphic when describing the complex anatomy of an eye.
Organizational

These graphics help students grasp the flow or sequence of a difficult topic. Possible organizational graphics include drawings, maps, flowcharts, or animations. For example, an instructor could create a flowchart that demonstrates the steps a customer will make to purchase a product so that students not only read about the process but also see it laid out in a way that complements the written text. For instructors interested in creating their own graphics, programs such as Piktochart or even just PowerPoint can help individuals leverage their subject matter expertise to create them instead of relying on publisher material.
Relational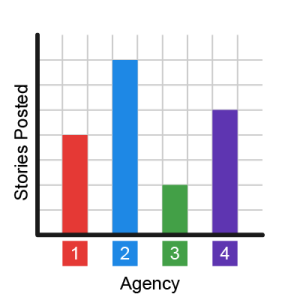

This type of graphic relies on data to display trends and other relations between different variables. Examples include bar graphs, pie charts, histograms, and scatter plots. Instructors shouldn’t shy away from utilizing these figures in their online classroom. Graphics can be crucial for helping students interpret and analyze data to form their own understanding. Consider a political science instructor who creates a bar chart based on the frequency of political stories posted online for each local new agency. Students could then interpret this graphic to form arguments for the final assessment on trending online stories.
Decorative
Lastly, there’s one graphic type that’s frequently used in online courses but adds little instructional value. Decorative graphics should be used sparingly, since they do not contribute to students’ comprehension of the learning material. These types of graphics are aesthetic in nature. Think of clip art, stock photos, and gifs. Instructor may add decorative graphics to add appeal to text-heavy content. Many times, these types of images can actually cause more harm than good to students’ cognitive load! You’re better off with no images than irrelevant and distracting graphics.
Graphic Types and Examples
Whatever type of graphic you use in your course, it’s important that you do it intentionally and with a firm understanding of its role in the context of your course content. Consider the following examples and how you might be able to use similar ones in your own course.
| Graphic Type | Role | Examples |
|---|---|---|
| Representational | Describes or portrays content to focus on the components that students should learn | Biological diagram, building blueprint |
| Organizational | Helps students grasp the flow or sequence of a difficult topic | Maps, hierarchies, flowcharts, animations |
| Relational | Relies on data to display trends and other relations between different variables | Bar graphs, pie charts, histograms, scatter plots |
| Decorative | Is aesthetic in nature; may add decoration to add appeal to text-heavy content | Images signaling the beginning or end of a lesson or section |
Incorporating Graphics Into Content
Choosing appropriate graphics is more complicated than determining how aesthetically pleasing an image is. Selecting an instructionally sound graphic requires you to determine the most appropriate means to convey this information to students. Many graphics have the potential to enrich your course content, but it’s important to ensure that they’re used correctly. By correctly following the principles of multimedia learning, you help ensure that your images not only contribute to your content but also encourage information retention and student success as well.
Infringement and Fair Use
While incorporating graphics into your online course has a wealth of potential benefits, it doesn’t come without risk. It’s essential for you to determine whether the graphic is free for you to use or protected by copyright.
Follow these tips to ensure you have the legal and ethical right to use that graphic:
- Assume all graphics are copyrighted until proven otherwise.
- Always ask for permission and use proper citations.
- Don’t manipulate graphics or take pieces of them—it’s still infringement.
- Publisher material is copyrighted and requires proper permission and citation.
- When in doubt, don’t use the graphic.
In an increasingly digital age with wide distribution of images online, it may seem unclear which graphics are listed for fair use. Rejoice! There are several royalty free websites you can use right now: Flaticon, Freepixels, Pixabay, and PicJumbo. If you are still unsure, Google Images released a user-friendly search page so you can filter for usage rights. We advise you select the “Labeled for reuse” option and always properly cite the source. For additional information, refer to Google’s “Find Free-to-Use Images” article.
Conclusion
Including graphics in your online course can have profound implications on student learning. With this in mind, it’s important to determine what types of graphics different parts of your course need so that appropriate visuals can be created and added. By ensuring this and whether the graphics you choose fall under fair use and copyright law, you have the potential to add instructional value to your course elements.
References
Clark, R. C., & Mayer, R. E. (2016). E-learning and the science of instruction: Proven guidelines for consumers and designers of multimedia learning (4th ed.). Hoboken, NJ: Wiley.
Clark, R. C., & Lyons, C. (2016). Graphics for learning: Proven guidelines for planning, designing, and evaluating visuals in training materials. San Francisco, CA: Jossey-Bass Pfeiffer.
Mayer, R. E., Moreno, R., & Sweller, J. (n.d.). E-learning theory. In Learning Theories. Retrieved from https://www.learning-theories.com/e-learning-theory-mayer-sweller-moreno.html